This methodology overview is part of our work for the NADIKI project.
Introduction
In this paper, we want to show an end-to-end model for accounting the environmental impact of a software application (’application’) we will use the example of an AI model & service to illustrate this. The main idea of this work is that an application maintains an environmental impact account, similar to a bank account, where the environmental impacts are accumulated over the life cycle of the application.
To improve the readability of the document, we use a specific language and words that hide some of the complexity. Here is an overview of the concepts behind the words:
Digital Resources: Capacity to compute, store and transfer data as produced by a server entity from energy.
Digital Resource Type: When we talk about types for digital resources in this document, we refer to compute, storage and network resources as ‘types of digital resources’.
Entity: We refer to the different entities in the value-chain of infrastructure required to run a software application. These entities are: Data Center Facility (Building), Rack (housing servers and network equipment), Server (IT equipment producing computing, storage or networking capacity), Client Device (e.g. Laptop or Phone). For now we exclude networking equipment.
Account: Akin to a bank account, it’s a multi-value ‘bucket’ where the environmental impacts are accumulated for an entity (see below).
Productive Impact: Productive impacts are caused by the entity providing useful work, e.g. a server might use energy to perform computation for an application.
Non-Productive Impacts: Arise from an entity being operational/running but not performing useful work, e.g. a server might be idling but still consuming energy or a data center might be half-empty, which will lead to half it’s embodied impact to be attributed as non-productive.
Useful Work: We consider useful work performed on the last step of the value-creation chain. A server entity provisions digital resources. These are by default Non-Productive. The server, when running and provisioning resources, consumes energy. This changes when an application uses those provisioned resources, in which case they become productive. The goal of the server provisioning, virtualization or orchestration systems is to maximize the amount of productive resource usage.
Operational Impacts: These are environmental impacts which are created by the operation of the entity - in the case of the data center facility, this might be energy and associated GHG emissions for operating the cooling systems; for a server, it may be the energy consumed for running.
Embodied Impacts: These are static impacts which are caused by the creation (manufacturing) of the respective entity. The embodied impacts represent the starting balance.
Indirect Impacts: We use this account to describe the indirect impacts caused by a given entity, e.g. if a rack is to be running, this requires a data center facility. If that facility can house 100 racks, than each rack has an indirect impact of a 100th of the direct impacts of the facility. We do this, so that each entity can be assessed on it’s own, while making the indirect impacts visible on each entity as well.
Useful Life: Each entity has a useful life, for which we assign reasonable defaults. The useful life is expressed in years.
Now the complexity lies in the following chain of calculations:
Calculating the starting balance of Embodied Impacts for each entity
Accurately recording the Operational Impacts for each entity
Proportionally allocating the Impacts to the Account of the application, depending on the actual usage of all entities by the application.
For the allocation, taking into account both virtualization as well as spanning applications across multiple data centers and servers (e.g. with many virtual machines or Kubernetes clusters/pods)
So let’s start with loading the impact accounts of the different entities. Please note that this calculation model is meant to allow a each entity to stand on it’s own, measuring as direct impacts the ones the entity is responsible for. All the account balances are eventually added up when allocating them to application as direct and indirect impacts. It is possible to use this model on a data center facility, a rack or a server individually. This is important as many actors in the digital infrastructure are ‘broken up’ across the value-chain, e.g. a co-location operator only owns & runs the facility, an IT infrastructure provider might rent a rack to install their own servers, a customer might
The model does outline the interdependencies between the entity, e.g. to calculate the GHG emissions for the energy use of a rack, the data center facility must provide the emission factor of the grid or on-site power generation.
Calculating the starting balance of each environmental impact account per entity.
If we use electrons as our ‘guiding path’, the entities through which the electrons are flowing are:
The Data Center Facility
The Rack
The Server
Digital Resource
Data Center Facility
As the first step we need to determine the starting balance of the account of the data center facility. This means determining the Embodied Impact of the facility.
To do this we need to consider the following components of the facility. If you can’t get this data from the facility, we have put together a reasonable default assumption based on public information that you can use.
Lifetime: 15 years (default assumption)
UPS System
Grid replacement generators (diesel, gas)
On-site generation assets
Building (shell, supporting infrastructure, floors, …)
Cooling system (inside the whitespace/air handlers, transport, e.g. pumps, heat exchangers, chillers, cooling fluids)
Air treatment systems (humidification/dehumidification)
Fire extinguishing systems
When the data from all the components is collected it can be added up. This will be the total Embodied Impact of the facility. This should then be divided by the Lifetime of the facility to get the annual starting balance. If the facility is empty, meaning there is no IT equipment in the facility; the starting balance for the first year might look like this:
Facility Total Embodied Impact over Lifetime: 15.000 units
Facility Environmental Impact Account (year 1): 1.000 units
We will add the operational impacts to this account further below in the respective section. For now we have built the base account balance for the facility that is exists irrespective of the usage of the facility.
Rack
For the racks we run through the same process as for the facility. For each rack we need to collect the following information to determine the total embodied impact and thus the calculate the annual starting balance of each rack.
Useful Lifetime: 15 Years (default assumption)
PDUs
UPS Battery
Rack Shelf
Once this information is collected, we can again calculate the Rack Total Embodied Impact and divide it by the useful lifetime in years to get the annual starting balance for the rack’s environmental impact account.
If the rack is empty, the balance on the account might look like this:
Rack Total Embodied Impact over Lifetime: 1.500 units
Rack Environmental Impact Account (year 1): 100 units
Server
The servers, in principle, should be the simplest to determine the starting impact for, as they are a single product by a single vendor. Unfortunately, not all vendors provide LCAs or EPDs for each product. Luckily there is a plentitude of APIs, most notably the Boavizta API, which can be used to get an estimated for the Embodied Impacts of any server model.
So for the server, we can determine the starting balance like this:
Useful Lifetime: 5 Years
Server Hardware
With this information, we can calculate the Server Total Embodied Impact and divide it by the lifetime to determine the annual starting balance for the server. For the sake of this calculation, assume that the server is turned off.
Server Total Embodied Impact over Lifetime: 1.500 units
Server Environmental Impact Account (year 1): 300 units
Digital Resources
As digital resources do not physically exist–they only come into existence when the server is powered on and their Embodied Impact is equal to the server’s impact, we don’t set a starting balance for digital resources.
Summary of Embodied Impacts
Now to summarize our environmental impact accounts in January 1, with a single rack in a data center facility and a turned-off server, looks like this:
Facility Environmental Impact Account (year 1): 1.000 units (15.000/15 Years)
Rack Environmental Impact Account (year 1): 100 units (1.500/15 Years)
Server Environmental Impact Account (year 1): 300 units (1.500/5 Years)
Adding the operational impacts to the environmental impact accounts
That was the easy part. Now let’s add the operational impacts of each entity to the balance. These are the measurements that likely vary throughout the year and need to actually measured in each entity and the measurements added on at least an hourly scale to the accounts.
The challenge is that some operational impacts can have a positive or negative impact on the balance, which needs to be calculated for each entity using dedicated logic. Measuring alone is not sufficient, a conversion and first allocation to the right impact indicator is needed. In our list of metrics for each entity, we include explanations on those conversions. We use the same list of entities as in the previous chapter.
Data center facility
For the facility, the calculation is straightforward and mostly focusses on energy, water and waste. The main challenge is to differentiate the various energy sources, such as local generation, nearby renewable generation as well as the fuel of local generation (e.g. when the diesel generators are running). This is relevant to calculate the GHG impact indicator from the energy use.
Data Center Operational Impact:
Again for now, we assume the facilities are empty, yet the cooling and other overhead systems are running and consume 10.000 kWh over a year. During that year, on-site solar panels generated 3.000 kWh and procurement of wind energy from a farm in a 50km radius contributed another 3.000 kWh of renewable energy to the balance sheet. During that year, the average grid emission factor was 1 kg of CO2-eq/kWh. The diesel generators were not running during that time.
This means the facility balance now should look something like this:
Facility Environmental Impact Account (Year 1):
We consider the impacts as productive, if the data center is filled with servers. If 100% of the available white space is covered with servers which are running, the operational and embodied impacts are 100% productive.
Rack
For the rack, the operational impacts are coming from the energy that is passed-thru the rack–both thermal and electrical energy. Further the rack inherits indirect impacts from the facility, e.g. the operational and embodied impacts from the facility are allocated to each rack in the facility (evenly). This allows the rack to have visibility (but not per-se responsibility) into the impacts it’s existence is causing ‘downstream’ in the value chain.
Rack Operational Impact
Dependent Metrics from the Data Center Entity (see “Metrics that need to be exposed”)
A rack is considered to be productive if the Rack Design Capacity and Total Energy Use are close to equal, as this means that the delivered power is fully utilized.
To calculate the all the impact (operational, embodied and indirect) of the rack, we need to have some metrics available from the data center, e.g. to attribute the total water consumption of the facility to a single rack. We do this by dividing the total impact values, by the number of racks that the facility can support, distributing the operational impacts of the facility evenly into the rack.
For the example calculation, we assume the facility only has capacity for 10 racks, and that the rack is 50% occupied (Rack Design Capacity/Total Energy Use). We assume that the rack has a design capacity of 5 kW.
Now the account might look like this (by the end of the year):
Non-Productive Impact:
Productive Impact:
Indirect Impact (from the Facility):
Server
For the server, the operational impacts is coming from the energy consumption of the server, as it’s the main input. The server also demands cooling energy, which we account for using the Power-Usage-Effectiveness value provided by the data center. Lastly, we attribute the indirect impacts from the facility. We do this the proxy of power of the server, vs. total available power for servers in the facility, which is explained below. Lastly, we consider a server to be productive, when it’s actual power consumption is close to it’s rated power consumption.
Server Operational Impact
Dependent Metrics from the Data Center Entity (see “Metrics that need to be exposed”)
If a server is running for a year and it’s Rated Power is 1 kW, it’s total possible power consumption would have been 8.760 kWh. If during that time, it only used half, 4.380 kWh, we can consider that value to be ‘non-productive’, as the server was manufactured but is not fully utilized.
Further, to assess the indirect impacts, we must receive some values from the data center, as listed above. In our example, we consider the Rated Power to be 1 kW and the data center facility’s total capacity for IT to be 1.000 kW, which means that we allocate a 1000th of the operational impacts of the facility as indirect impact to the server.
For our example, we assume that the server is 50% productive.
Now the account might look like this (by the end of the year):
Non-Productive Impact:
Productive Impact:
Indirect Impact (from the Facility):
Attributing the Operational and Embodied Impacts of the Server to Digital Resources
Attributing the environmental impact to digital resources is an approach we first explored in our SoftAWERE project (final report soon to be released). One can think about it like this:
A server, when running makes digital resources available for an application to use.
Let’s take a real server for which an LCA is available - the Dell PowerEdge R740 (official LCA is here). This server is configured to produce the following digital resources:
2 x Intel Xeon Gold 6132 CPUs (https://www.intel.com/content/www/us/en/products/sku/123541/intel-xeon-gold-6132-processor-19-25m-cache-2-60-ghz/specifications.html)
12 x 32 GB RAM = 384 GB Total
1 x 400 GB SSD + 8 x 3,84 TB SSD = 31,12 TB SSD
Dual Port 10 GbE Network Card
2 x 1.100W PSUs (Rated Power = 1.100W)
Using this information, we can say that the server uses 1.100W to provide at the maximum 100% CPU Usage on the two CPUs (28 Cores), 384 GB of RAM, 31,12 TB storage capacity and 20 Gbit network capacity. Or expressed simpler: the server produces digital resources, using 1.100W of input energy. But how do we distribute the 1.100W to each type of digital resource?
Allocating operational impacts to each digital resource type
In our previous research we have defined the following assumptions based on existing research to allocate the operational impacts to each type of digital resource.
Allocating embodied impacts to each digital resource type
For the embodied impacts, the Dell study offers a useful graph for creating an attribution ratio. Note that whereas for operational impacts, the CPU is clearly dominant, for embodied impacts the disks are the primary factor.

With the data from the LCA we can set up our Embodied Impact account for the Server entity like this (using the Lifetime assumption from the section on Servers above for 5 years). Let’s assume the server is idling, so we can allocate all the embodied impact to the Non-Productive sub-account. All data is accumulated at the end-of-year for simplicity.
Server - Embodied Impact Account
We can also charge the operational account for the server using the data from the LCA as well as the metrics from the data center (see the section on Operational Impact of Servers for details). Again, we assume the server is idling.
Server - Operational Impact Account
Allocating impact to digital resources
Using our logic of environmental impact accounts and the percentage-allocation rules we defined above, we can fill the impact accounts for each digital resource type produced by the server. We assume it’s completely idling–allowing us to assign it all to the non-productive account of each digital resource type. Let’s further assume that the server is running for a year. We can use the charged accounts from above to simplify the calculations:
CPU Usage
Operational Impacts
Embodied Impact
Indirect Impact
Memory Usage
Operational Impacts
Embodied Impact
Indirect Impact
Storage Usage
Operational Impacts
Embodied Impact
Indirect Impact
Network Usage
Operational Impacts
Embodied Impact
Indirect Impact
Now if you imagine that half of the CPU is fully utilized, half of the non-productive account of the CPU is shifting to productive. If an application would run on the bare-metal server is occupying half of the digital resources, you can allocate all of the impact to the application, separated by productive and non-productive and even break it down by the type of digital resource that the application is utilizing. It’s not very helpful yet as when an application is running on a single bare-metal server, the impact accounts for the server can be utilized directly for impact reporting. But we will use the digital resource attribution in a later step.
Weaving it all together–for a software application
We’ve charged all the physical impact accounts of all the machines and buildings in the value-creation chain below the application. So far so logical. Now comes the hard-part, connecting it all to the actual application.
On a conceptual level, we can say that if an application is running and doing anything that utilizing the server or/and it’s digital resources, that’s productive. Let’s not debate if the application is doing something useful or not–that’s the territory of philosophy.
What’s not productive is an application placing a reservation, e.g. booking a virtual machine with 16 GB memory and 16 cores, of which it uses only 30% at the most. This 70% of ‘reserved but not utilized’ is unproductive, as it could be used by another application.
With this definition of productive and non-productive in hand, let’s dive into the different approaches to mapping the environmental impact accounts we’ve assembled to the application. Note it’s all additive and cumulative, e.g. if an application uses two physical servers at 100% utilization for a year, the impact accounts of both servers are added together and are allocated to the application.
Ultimately what we are trying to do here, is allocate the responsibility for impact to the right entity. If an application is making reservations it doesn’t need - that should be the responsibility of the application owner to fix. Equally we assign the indirect impacts to an application as well, as it’s the application owner who has the choice over which data center facility, IT or cloud infrastructure provider they use. And it should be their responsibility to choose for low-impact, creating an incentive for those providers to do better.
Approach 0: Bare-Metal Allocation
The easy one. If an application uses one or multiple bare-metal servers, the total digital resources of the bare-metal server are the reservation (non-productive) and the actual usage of digital resources is the productive use.
This can be calculated in the two ways outlined above. Either less precise by using the server’s impact account and simply allocating it all to non-productive. Then calculating the percentage of digital resources actually used, e.g. if a server offers at most 32 Cores, 128 GB of memory, 100 Million I/O Ops/10 Gbit bandwidth and 100 Million Network Ops/100 Gbit Bandwidth and the application in aggregate using 30% of that capacity, then you can move 30% of the impact account of the server into ‘productive’ for the application.
The second way, also outlined in the previous section is to break down the impact accounts onto each type of digital resource and calculating it directly through actual application or process usage of each digital resource type, e.g. Disk I/O might have more embodied impact than operational, whereas the CPU is operational impact heavy and lower on embodied.
To do either, one needs to monitor digital resource usage of the server, using an IT infrastructure monitoring tool of choice.
If an application spans across multiple servers, the accounts should be calculated per-server and then added to the total impact account of the application. It’s important to avoid averages here as the servers may have different utilization profiles (think: a database server and an application server working together to deliver an application).
Meet the Hypervisor & Orchestrator
In the context of our approach, the Hypervisor’s and Orchestrator’s can be understood as reservation managers. One of their jobs is actually to close the delta between reservations & usage, maximizing the utilization of the underlying hardware. They also offer a level of isolation, which generally makes measurements more complex, but there many tools out there that circumvent this, see the list in the Appendix.
The great thing is that these systems have a complete overview of all reservations per virtual machine, container or pod (’bundles of digital resources’) that are running on a server or within a cluster of servers. They also have accurate data on the digital resources that each bundle is using at any given time. And they usually know all the specifications of the host system they are running on (e.g. total CPU, memory, disk and I/O capacities).
In Approach 1 and 2, if accessible and possible, data from the Hypervisor or Orchestrator should be preferred.
Approach 1: Using Digital Resources Monitoring (consumption based)
With this approach, you are ignoring the non-productive impacts and focus on the turning the digital resource consumption of the application into environmental impact. You do this by having, e.g. an IT monitoring system that monitors the digital resource usage of the application, and combining that usage with the impact account for each digital resource (as outlined under ‘Attributing the Operational and Embodied Impacts of the Server to Digital Resources’).
This means you need the information from the server on the impact account per digital resource that is being produced.
As a mental model, you can see this as a wire transfer. If the application is utilizing 10% of the CPU of the underlying server system for a day, that means the server must ‘send’ the impact of the CPU usage for that one day to the application (productive) account.
If the applications spans across multiple systems, e.g.
10 Kubernetes Pods
2 Bare-Metal Servers
14 Virtual Machines
The transfer must happen for each of these individually and be added up to the application impact account. You can not measure digital resource consumption on each and build averages or sum those first, you need to calculate the impact to be attributed to the application for each bundle or physical server based on the actual usage occurred on that system.
Approach 2: Using Digital Resource Allocation (reservation based)
Let’s say, you don’t have any IT monitoring system to measure the consumption of digital resources, but you got the following information from the IT infrastructure team (or someone else).
The application is using:
3 Virtual Machines with 16 GB Memory each, 16 Cores and 100 GB Disk
2 Bare Metal Servers with 128 GB Memory each, 96 Cores and 1.92 TB Disk
10 Pods with a resource request of 512 MB of memory each
Now the impact accounts of the servers providing the bundles or bare-metal capacity for each digital resource (as outlined under ‘Attributing the Operational and Embodied Impacts of the Server to Digital Resources’) can be used to calculate the non-productive impact account for the application. For this you can multiply the reservations with the digital resource type account, e.g. 128 GB of memory * operational and embodied impact account for the digital resource type ‘memory’ for that server.
For the virtual machines (VM), you need to to first calculate the percentage the resources that the VM is reserving of the total resources available in the underlying server, e.g. the server might have 128 GB of memory and 16 GB represent 12.5%. So you can take 12.5% of the memory’s digital resource impact account and allocate it to the application (as non-productive).
Approach 3: Combining Reservation & Consumption Approach for measuring productive and non-productive impact
The real magic happens when you combine both of these approaches. Because it enables you to close the delta of productive and non-productive environmental impact. If you can’t work on reduction for whatever reason, closing this delta at very least reduces the amount of wasted energy and manufactured equipment that is idling.
So for the portfolio of servers, virtual machines, containers and/or pods that the application is responsible for, you first calculate the non-productive account as outlined in Approach 2. This is the baseline, 100% idling, 100% non-productive. Then you add the measurement of usage for digital resources and can now continuously shift (’wire’) impact from the productive/non-productive account, depending on the actual usage.
Remember the accounts are cumulative, hence it will become a ‘an optimization game’ to avoid filling the non-productive account further, by ensuring utilization.
Summary
In short, for mapping the environmental impact of the infrastructure to the servers we are proposing that you first create an impact account for the reservation of resources created by the bundle of resources (virtual machine, pod or else). This account is the non-productive environmental impact and is defined by the share of environmental impact of the underlying server in relation to the amount of digital resources the reservation occupies on the server.
From there, you continuously shift the environmental impact (remember it’s cumulative!) to the productive account when the digital resources that are reserved are actually utilized. This way you can get an accurate reading of ‘resource efficiency’ of the application as well as total environmental impact created during the life cycle of the application.
When an application consists of many of those bundles (e.g. thousand virtual machines), we recommend you keep an impact account for each bundle and then aggregate the accounts on an application level. This also allows you to include development and staging environments in the calculation and when bundles are removed or added, they are simply added to the cumulative account of the application.
Since environmental impact can never be reversed, e.g. resource depletion or carbon emissions, can not be reversed and neither can energy be ‘put back’ it’s critical to keep all the accounts cumulative. Unfortunately, reducing an application’s infrastructure from a thousands virtual machines to hundred, cannot change the past. It only affects the rate of change, meaning the impact account accumulates impact less quickly.
Outlook
With this methodology, we introduce a few new key ideas:
Keeping cumulative accounts for environmental impacts
Attributing or distributing the environmental impacts from the total value chain of an application to the application itself
A holistic list of environmental impact indicators
Appendix
List of environmental impact indicators for software
Total Energy Use (kWh)
Total GHG Emissions (CO2-eq)
Resource Usage - Abiotic depletion potential (ADP)
Waste of electrical and electronic equipment (WEEE, tonnes)
Metrics that need to be exposed for by each entity to enable impact calculation by other entities:
Data Center
Emission Factor of IT Energy Provided:
We will update this list as we implement the methodology in an upcoming demonstration project–NADIKI.
Conversion formula’s
List of assumptions for cloud region data centers
List of tools to measure energy use of servers
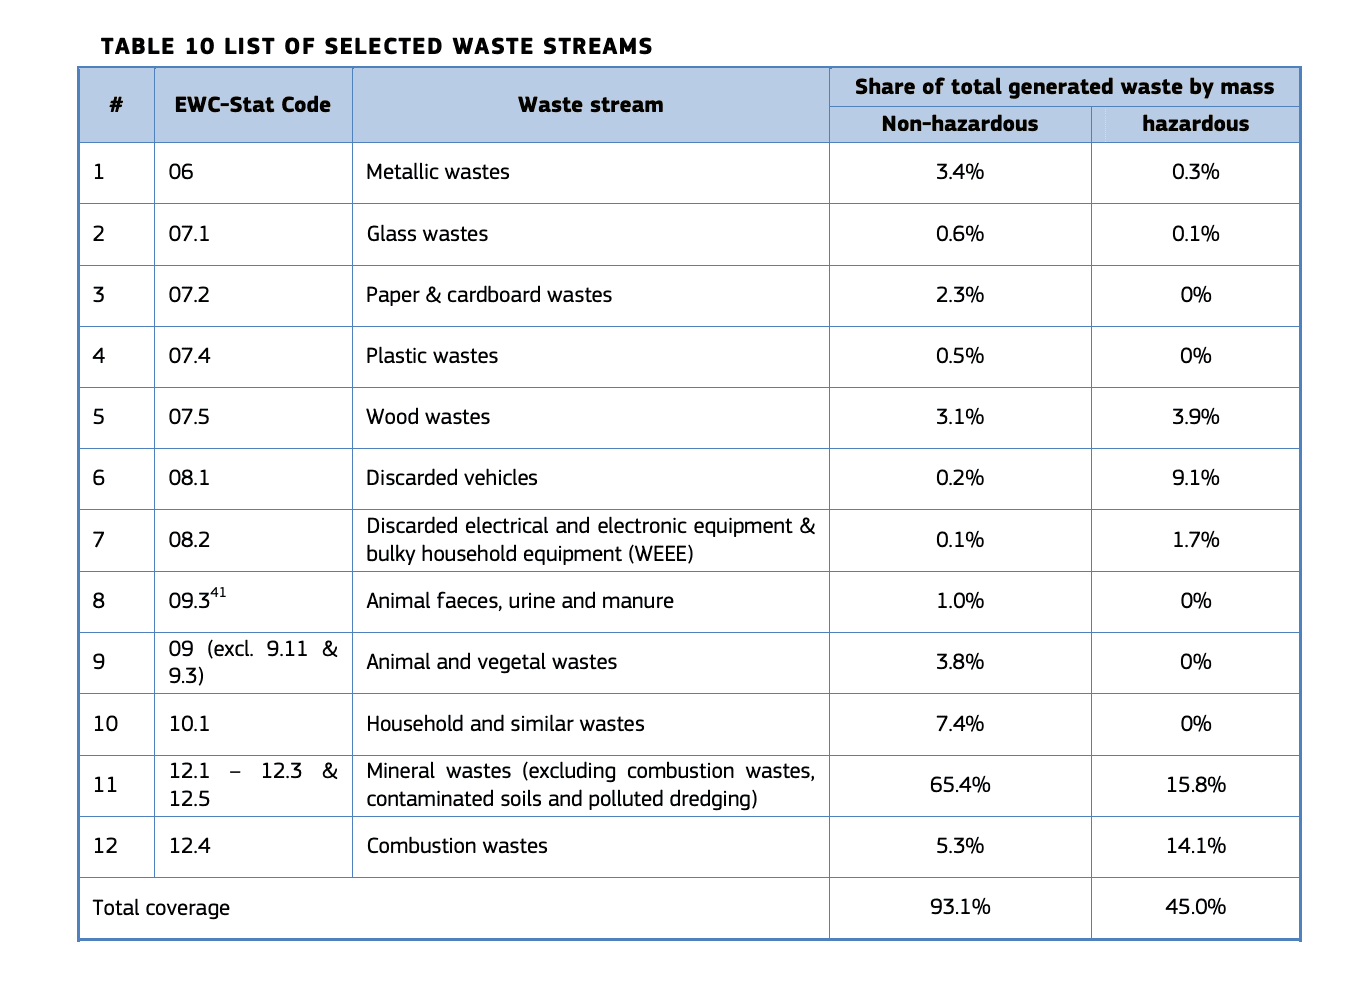
List of waste streams to consider for the facility
https://eplca.jrc.ec.europa.eu/uploads/LCindicators-framework.pdf